Count Your Money: Step-By-Step Accounting for New Airbnb Hosts

One thing I’ve learned throughout running an Airbnb business for 5 years is that being on top of my finances at all times is critical to my survival.
There are some small business owners that I know take accounting for granted and their finances are a mess. As long as there’s money in the bank, they’re happy.
In this article, I will share with you a step by step process on how I keep my Airbnb finances in check using a simple Excel Spreadsheet with Pivot Tables.
You can use this as an example and change the details to suit whatever business you have.
Why is it Important to Be On Top of Your Finances?
If your Airbnb business generates around RM30,000 at the end of the month in sales, you’re probably happy, right?
Who doesn’t like to see a lot of money in their bank account? But let’s not forget that you have overhead to pay off (rent, staff salary, bills, etc.).
So how much is your take-home pay from that RM30,000? It’s possible that your net profit is actually just RM 3,000, or even -RM 2,000. How can you tell?
With proper bookkeeping and the power of Pivot Tables in Excel, you can see if your business is profitable or not by automatically summing up your monthly revenue, expenses and net profit. It’ll look something like this:

You’ve also invested money into purchasing furnishings and security deposits to set up the place. All this needs to be accounted for.
This 1 Excel file will be the centralized document for you to see vital financial information at a glance.
The Only 5 Basic Accounting Terms to Know for Airbnb Businesses
- Deposits
- Setup & Asset Purchases
- Revenue
- Operating Expenses
- Net Profit before Taxes
Deposits
Security Deposit: This is applicable if you’re renting the place out and planning to sublet. A typical deposit is 2.5 months of your monthly rental.
The good thing about this is that the capital is refundable at exit after the completion of your lease tenure and assuming there’s no damage claim from the landlord(s).

Setup & Asset Purchases
If you’re planning to rent and sublet, It’s a good idea to get a property as fully furnished as possible to reduce the amount of furnishing you have to buy to make the place habitable.
Here’s the furnishing list I made to set up one of my apartment:

Asset Purchases is a one-time equipment purchase necessary to run my business. I typically consider buying the following items as an ‘asset‘:
- Vacuum cleaner (RM 450)
- Steam Cleaner (RM 700)
- Trolley (RM 100)
- Computer (RM 4500)
- Printer (RM 250)
- Carpet Cleaner (RM 1500)
- Steam Iron (RM 1200)
Revenue
This is all the money coming into your bank account from all of your sales channels such as:
- Room Sales
- Car Park Sales
- Room Service Sales
- Extra Bed Sales
- Sim Card Sales
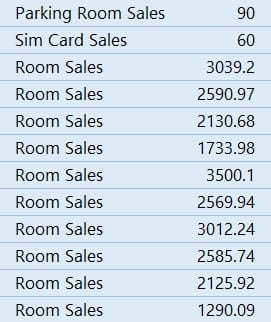

Cash Sales: From time to time, you’ll get people who want to extend their stay and they’ll pay you cash in exchange for a cheaper rate than what they see online.
A good accounting practice is to always deposit the exact same amount of money into the Cash Deposit Machine (CDM). This is to make it easier for you to keep track of where this money came from.
For example, if you made 2 cash sales today at RM 300 & RM 450, it’s always a good accounting practice to deposit RM 300 and then another deposit of RM 450 rather then lumping them both together into 1 deposit fo RM 750 in one shot.
Operating Expenses
Monthly expenses in order to run my Airbnb business:
- Rent or Mortgage
- TNB (electricity) bills
- WiFi bills
- Water bills
- Cleaning charges
- Laundry charges
- Maintenance for repairs
- Groceries
- Staff payroll
For a typical Airbnb business, rent/mortgage will take the biggest chunk out of your profits, so try to negotiate as low of rent as possible!

The other variable large expense is my TNB (electricity) bills:

Net Profit
Simply put, it is all the Sales (Revenue) for that month minus the money it cost to run your business (Operating Expenses) for that month will be your Net Profit.
Net Profit will determine the real financial health of your business.
For example, if your Revenue in a month is RM 30,000, but your net profit is only RM 2,000, this translates to a profit margin of RM 2,000/ 30,000 = 6.6% which is pretty low, you might want to consider doing something else.
A general rule of thumb I see most business use is to aim for a profit margin of around 50%. But this is not achievable in the Kuala Lumpur Airbnb scene.
To give you a realistic expectation, my highest profit margin is 33.33% and the average will be around ~20%
Step by Step Setup for your Excel SpreadSheet
These metrics are powerful pieces of information. All this can be achieved using Microsoft Excel which you probably have installed on your computer. If you don’t have it, you can use Office Online for free.
I would recommend using Excel over Google Spreadsheet as Excel’s Pivot Tables are way more powerful and versatile.
The sample I will walk you through is for a Vacation Rental Business with 2 running rooms that are advertised on more than 1 website (Airbnb, Booking.com, Expedia, Traveloka, etc). You can tweak and customize this to fit your situation.
Alright, enough chit chat, let’s dive right in with a blank new spreadsheet and fill in the first few columns with :
- Month
- Date
- Room
- Description
- Notes
As you populate this table with data, it’ll be a good idea to Freeze the Top Row:
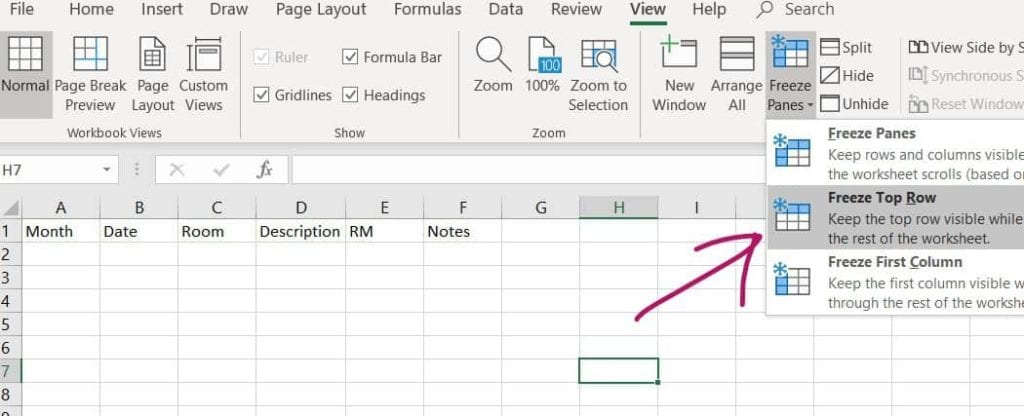
Save and name this Excel whatever you want and rename this sheet as ‘Data’.
Make all the sheets below to reflect the data that you’ll be populating in this Excel:

Back to the ‘Data‘ sheet, fill out the Description with the following expenses and income channels:

The above Descriptions will be the same for each month so you can use them as a template. Just copy and paste for the following months.
Money going out is always marked as (-) and money coming in is (+).
Tip: Notice on the month, I place the number 1 and not ‘January’. From my experience, the Pivot table had a glitch where it could not sort data based on months if you spell it out. So a quick solution is to name the months as numbers instead.
The ‘Date‘ is to record the exact date the transaction was made, i.e: 2 Jan 2020. This will make referring to receipts easier.
‘Pooled‘ expenses like groceries and staff salary is an expense that you pay to cover all of your rooms.
‘Maintenance‘ are typically repair works such as plumbing leak repair, replacement of small broken items, or Air-Conditioning servicing.
At the end of the month when you’re paying your bills, you’ll be populating each of the expenses manually, as an example:

If you have additional transactions, let’s say grocery purchases or maintenance costs, simply add a row at the bottom:

Notice that I did not fill out the RM cells of the Income sections because these will be automatically pulled out from ‘Room 1 Income‘ & ‘Room 2 Income‘ sheets (will explain in the next section).
Calculating Individual Room Sales
Any room that is occupied will have a sale for that day. Any room that is empty did not make a sale for that day.
Go to the ‘Room 1 Sales‘ sheet and fill out the first row with:
- Day – this is so I know which days are the best performing
- Date – the date a guest is staying
- Guest Name – the first name will do
- Source – which website did they book from
- RM – clean profit for that particular day minus OTA commissions
- Country – where are they from so I can understand who am I attracting online
- Parking – parking sales this is obviously for Malaysians driving.
- Notes – anything worthy to remind me of this particular guest.

I’m going to use a sample confirmed reservation from Booking.com:

The commissionable amount is RM 667.25. This is the amount the guest paid online to Booking.com.
The commission is RM120.11 = (18% of sales)
The net that I am getting from this reservation is the difference which is RM 547.14
This guest booked for 5 nights, this means that for 2 Jan 2020 to 6th Jan 2020, I made a daily sale of RM 109.43.
This number is commented in red on the pdf above. This PDF is saved and organized in my Google Drive.
Here’s how I populate this reservation into the ‘Room 1 Income‘ sheet:

As you populate this table with your daily sales, you ‘d want to automatically sum up your monthly sales for each month. Here’s how you can do that with a Pivot Table:
Select all the data (Ctrl + A) in ‘Room 1 Income‘ sheet and go to Insert Tab > Pivot Table:

Select destination ‘Existing worksheet’ and select somewhere on the right side of the table as shown below and hit ‘OK’
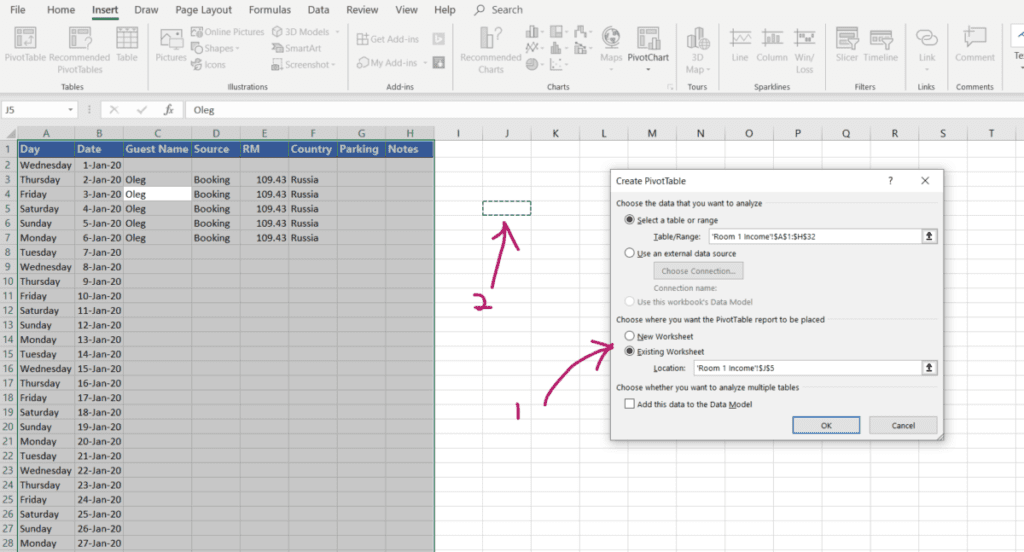
The PivotTable Fields Command Window will popup. Drag the ‘Date ‘ to the ‘Rows‘ box and drag the ‘RM‘ to the ‘Sum of RM‘ box.
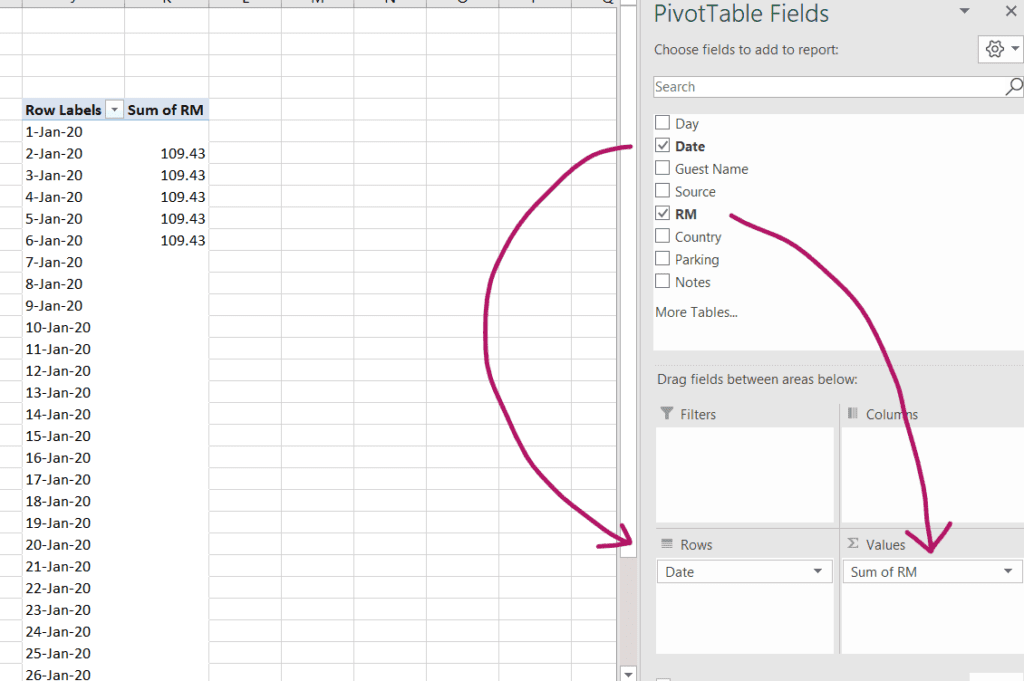
Now you want the Pivot Table to show your consolidated sales grouped per month, not in individual days (we already have that). Right-click on any date under the ‘Row Labels‘ column and click on ‘Group‘:

Click on Group by ‘Months‘:

Here’s what you’ll end up with. As you populate the ‘Room 1 Income‘ sheet with new sales as they come in, the PivotTable will automatically recalculate the sum for each month:

Here’s a sample of this PivotTable in action over a course of a year for one of my rooms:

Repeat this process for all of your available rooms. In this example, there are 2 rooms.
Connecting the ‘Data’ Sheet to Room Income’ Sheet
Ok now let’s get back to the ‘Data‘ sheet. The empty RM cell for the Room Sales for January needs to be connected to the ‘Room 1 Income‘ for January.
On the ‘Data‘ sheet, click on the RM cell of Room 1 sales and type in ‘=‘ without pressing enter:

Then, click on ‘Room 1 Income‘ sheet and click on the Sum of RM for that month. In this case, it is January.

Repeat this process for each room and each month.
Determining if your Business is Profitable or Not
It’s showtime. This is the moment that you’ve been waiting for.
Pulling everything together, on the ‘Data‘ sheet, here are the Pivot Tables that you want :
- Revenue
- Expenses
- Net Profit
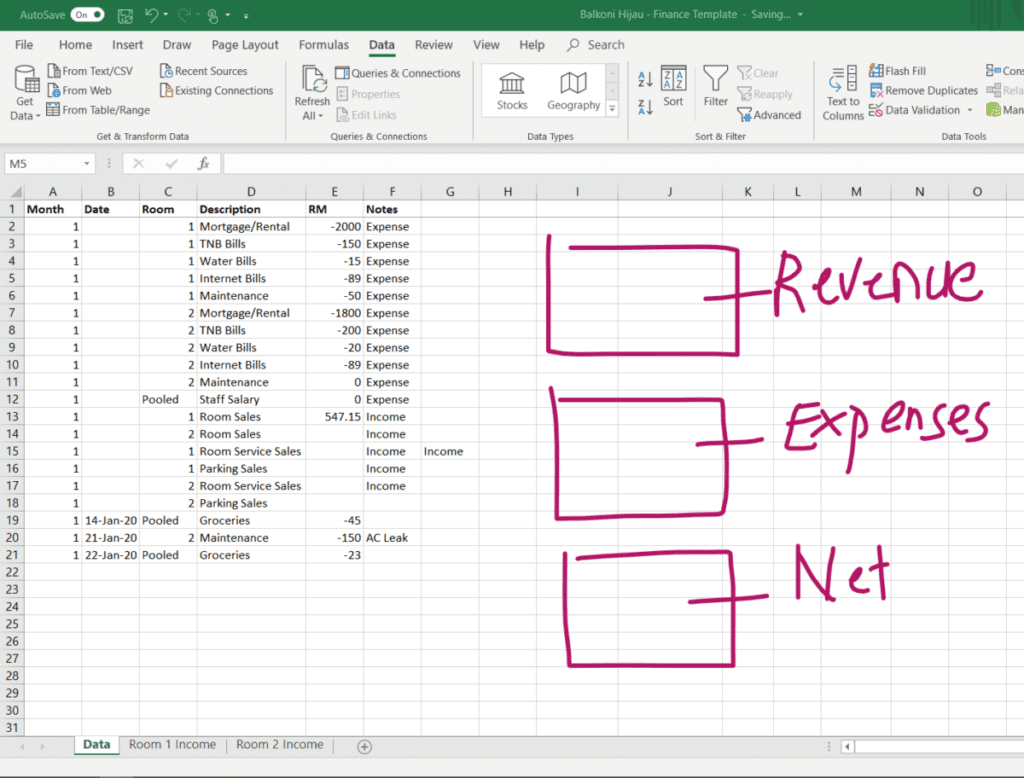
These Pivot Tables are dynamic, as you populate your ‘Data‘ sheet and individual ‘Room Income‘ sheets, these Pivot tables will update automatically.
Revenue by Month
Let’s start with the Revenue Pivot Table, we want this table to sum up all of our revenues and group them by months.
on the ‘Data‘ sheet, select all of the data and click on Insert > Pivot Table.
When the Pivot Table command window appears, drag:
- ‘month‘ to the ‘Rows‘ box
- ‘RM‘ to ‘Values‘ box
- ‘Description‘ to ‘filters‘ box
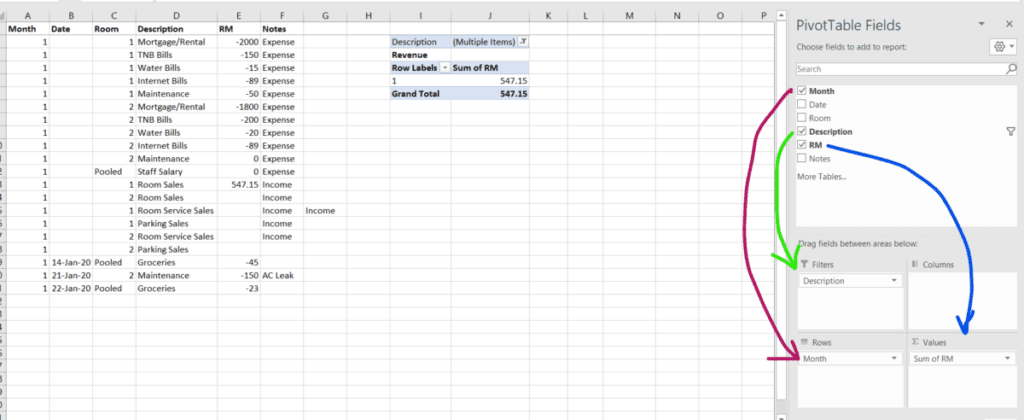
This Pivot Table is not fully defined yet, you need to tell the table what to include in the sum of calculations of Revenue, click on the filter icon on the Pivot Table Description:

We want this table to show us the sum of all revenues, so click on all of your revenue streams:

Great, now you have your Revenue Pivot Table all set up, it’ll add up all of your revenue streams and group them by month. It’ll look something like this:

You’ll be repeating this process to make the remaining 2 Pivot Tables:
Expenses by Month
Now you’re going to make another Pivot Table that will automatically add up all of your Expenses and group them by month.
Select all data again insert Pivot Tabel as you did before.
As you populate the Excell sheets, you’ll end up having 12 months worth of rows for each of your Pivot Table.
So to prevent your pivot tables from overlapping, select the location of the pivot table to be about 15 rows down:
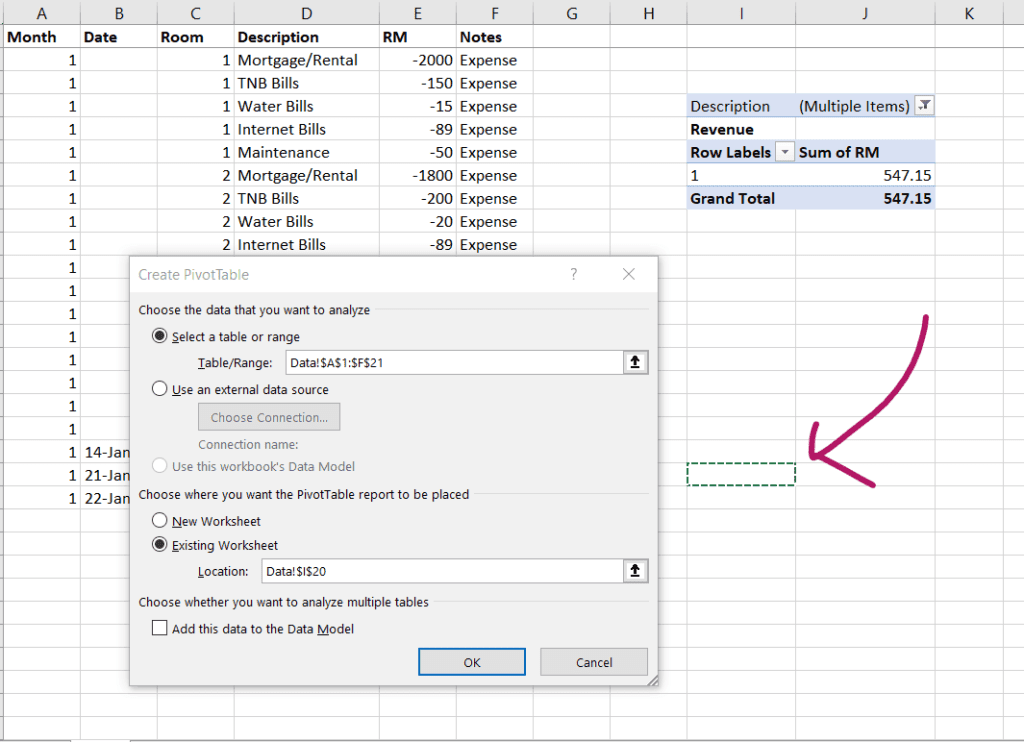
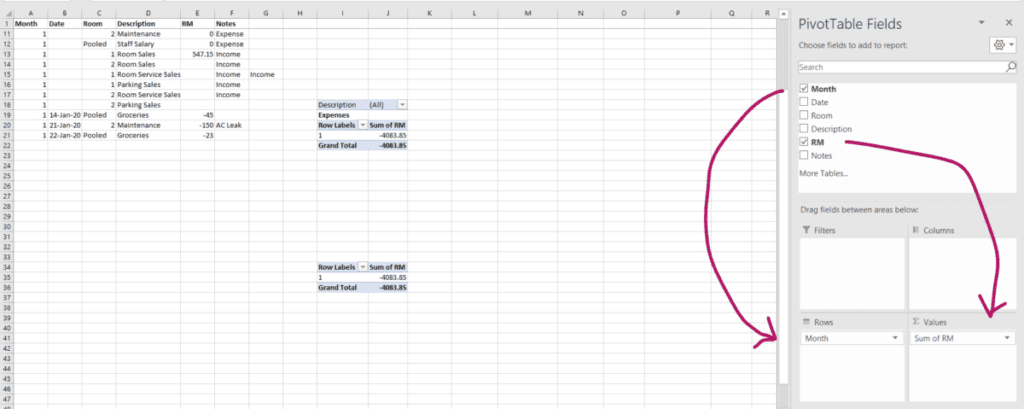
Drag the Pivot Table fields to the designated box as shown below:
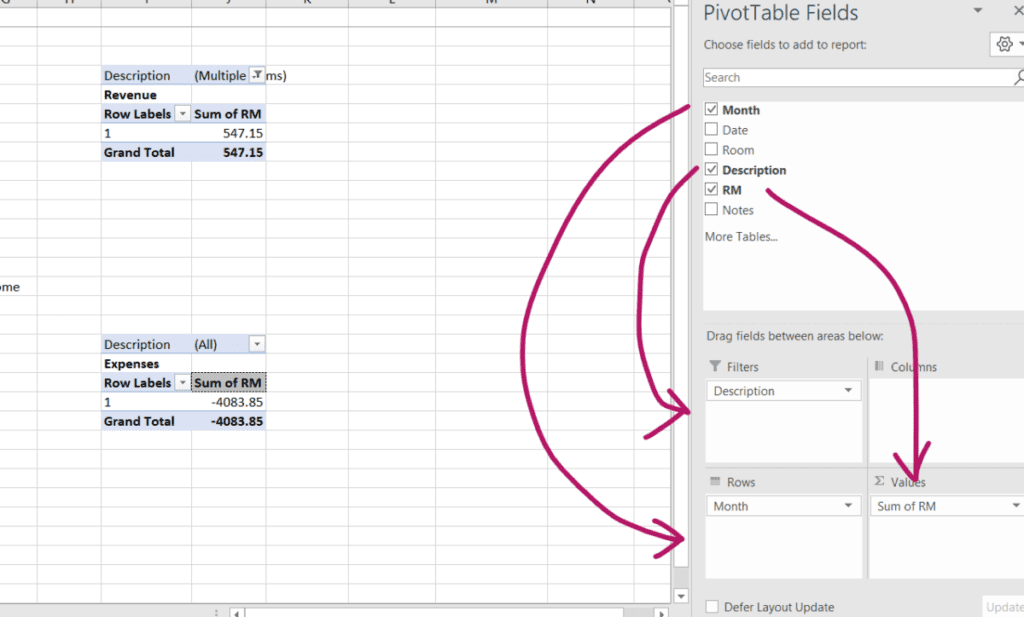
Great, Revenue & Expenses Pivot Tables all set up, let’s move on to the last one.
Net Profit by Month
Alright, this is probably what you’re going to be most concerned about. After deductions of all of your running costs, the Net Profit Pivot Table will automatically calculate your monthly take-home pay.
Select all data > Insert > Pivot Table. Drag the following parameter to the sum of all of your incomes and expenses, giving you your net profit :
Wrapping it Up
Now you have everything set up. You are in complete financial control of your Vacation Rental business as long as you populate this Excel with correct data.
Your finalized Excel should look like this:
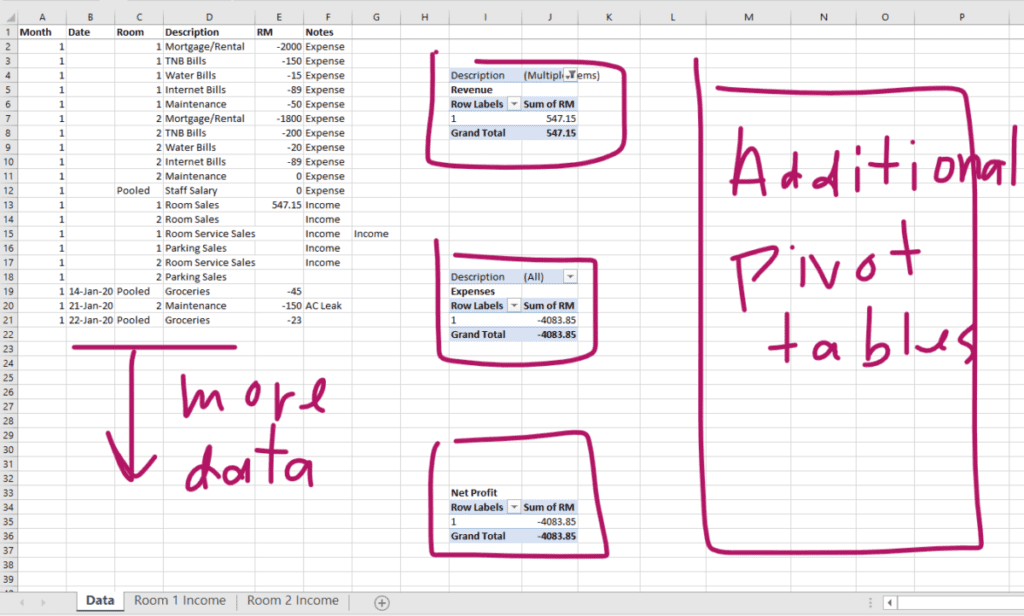
- As time goes and you have more income and expense transactions, you’ll log them into the data table on the left.
- Your 3 main Pivot Tables: Revenue, Expenses, and Net Profit.
- On the right hand of the ‘Data’ sheet, is some space for you to make additional Pivot Tables (e.g. electricity bills and maintenance costs grouped by month)
You can also make Pivot Tables at the Room sales sheets to understand your sales to dates such as:

- This particular room was booked mostly by local Malaysian guests, so I can use this data to do targeted Facebook Marketing later.
- I know what days in the week are least likely to get booked, then it makes sense to apply promos for those days.
- It’s clear where most of my guests booked online. So I will pay extra attention to that website.
Sample Excel Spreadsheet
I hope this guide has been helpful. Pivot Tables can seem a little daunting at first. But once you get the hang of it, it’s really easy and a very powerful Excel skill to have.
You can download the template below:


![[Airbnb Business]: How to Analyze Your Competitors Before Starting](https://helmihasan.com/wp-content/uploads/2020/07/analyze-your-airbnb-competitors-1-768x512.jpg)
